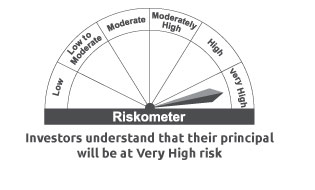
Nippon India ETF Nifty IT
An open ended scheme replicating/ tracking NIFTY IT Index
The investment objective of the scheme is to provide investment returns closely corresponding to the total returns of the securities as represented by the NIFTY IT Index before expenses, subject to tracking errors. However, there can be no assurance or guarantee that the investment objective of the Scheme will be achieved.
Note: The graph is plotted based on dividend reinvestment NAV.
The Scheme employs a passive investment approach designed to track the performance of Nifty IT TRI. The Scheme seeks to achieve this goal by investing in securities constituting the Nifty IT Index in same proportion as in the Index.
*In terms of SEBI circular no. SEBI/IMD/CIR No.4/ 168230/09 dated June 30, 2009, no entry load will be charged by the Scheme to the investor effective August 1, 2009. Upfront commission shall be paid directly by the investor to the AMFI registered Distributors based on the investors' assessment of various factors including the service rendered by the distributor.
**If charged, the same shall be credited to the scheme immediately net of service tax, if any.
Inception Date
26-06-2020
Benchmark
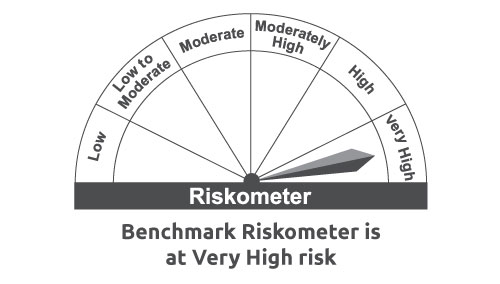
Nifty IT TRI
19.51
Methodology of Benchmark
Methodology of Benchmark
Scheme Fund Managers
Jitendra Tolani
0.26
Pricing Per Unit
1/1000th of Index
0.97
Creation Unit Size
100,000 Units
Exchange Listed
NSE
NSE Symbol
ITBEES
0.46
ISIN
INF204KB15V2
Total Expense Ratio^
Minimum Application Amount
Through Stock Exchange - 1 Unit & in multiples thereof.
Directly with the Mutual fund - in creation unit size viz. 100,000 Units & in multiples thereof.
Directly with the Mutual fund - in creation unit size viz. 100,000 Units & multiple of 1 unit thereof.
^w.e.f May 1, 2023, the execution value for large investors must be greater than Rs.25 crores (except for Schemes managed by Employee Provident Fund Organisation (EPFO), India and Recognized Provident Funds, Approved Gratuity Funds and Approved Superannuation Funds under Income Tax Act, 1961)
Load Structure
Entry Load : Nil, Exit Load : Nil
PRC Matrix
| Potential Risk Class | |||
|---|---|---|---|
| Credit Risk → | Relatively Low (Class A) |
Moderate (Class B) |
Relatively High (Class C) |
| Interest Rate Risk ↓ |
|||
| Relatively Low (Class I) |
|||
| Moderate (Class II) |
|||
| Relatively High (Class III) |
|||
Fund size
Monthly Avg
Rs.2991.56 Cr
Month End
Rs.3079.51Cr
Total Expense Ratio - includes additional expenses provided in Regulation 52(6A)(b) and 52(6A)(c) of SEBI (Mutual Funds) Regulations, 1996 and Goods and Service Tax on Management Fees.
Data as on November 30, 2025
Long term capital growth
Investment in equity and equity related securities and portfolios replicating the composition of NIFTY IT Index, subject to tracking errors
*Investors should consult their financial advisers if in doubt about whether the product is suitable for them.

Data as on November 30, 2025.
Note: Data related to Group Disclosure is unavailable
Data as on November 30, 2025.
Source: ACE Equity
Data as on November 30, 2025.
Source: As per AMFI Industry Classification
Source: As per Hang Seng Industry Classification